|
|
||||||
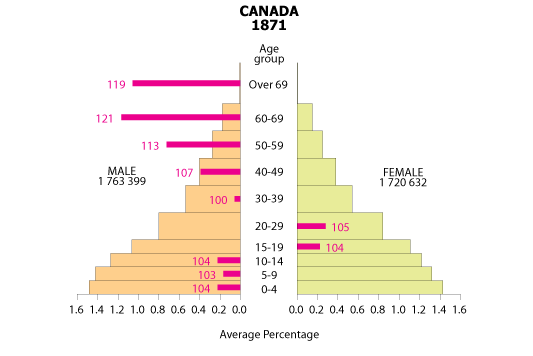 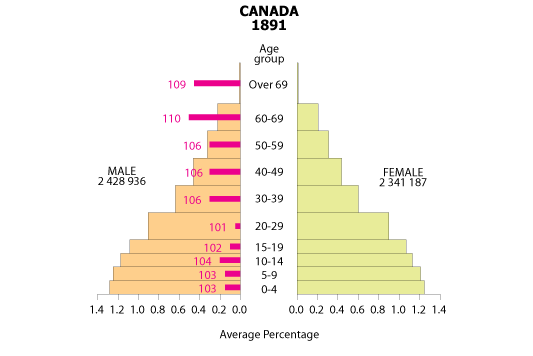 |
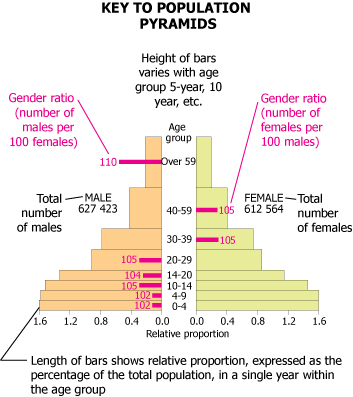
Population PyramidsCanada 1871, 1891Click for Key to population pyramids The population pyramids were calculated from census data which gave the population by sex and by grouped ages. However, various regions and censuses reported population using different age group ranges – 1-year, 5-year, 10-year, or more, and sometimes a mix of ranges. Therefore, to allow comparisons, the orange and green horizontal bars of the pyramid are standardized to show “Relative proportion” of males and females in each age group represented. The height of the bars is scaled to the number of years in the age group: 5, 10, or more. The length of the bars is scaled to the average percentage of the total population, in a single year within the age group represented by a bar. If a bar represents a 5-year age group, its gross percentage will be divided by 5; if it represents a 10-year period, divided by 10. As an example, for the Canada in 1891 there were 306 115 males in the 0-4 age group representing 6.4% of the total population (4 770 123) for which ages are listed. To standardize, 6.4% is divided by the number of years (5) in the age group, to give an average of 1.28% of the total population that is assumed to have been in each year of the age group. Therefore the scaling value for the length of the bar is 1.28%. In the 60-69 age group there were 107 536 males representing 2.2% of the total population; this is divided by 10 to give a scaling value of 0.22%. This method has been used to allow direct visual comparisons of bars, to see how population composition differed over time and place. This does not allow comparison of absolute numbers however, these are provided only by the total male and female values labeled on the graphs. The absolute numbers are also provided in a data file below. The red bars on the population pyramids show gender ratios for each age group, that is the number of males per 100 females or the number of females per 100 males. For example, in Canada in 1891 in the 60-69 age group there were 107 536 males and 97 575 females, or 10% more males than females. Therefore the red bar is positioned on the “male” side, scaled 10 mm long, and labeled“110.” |
Data Files (.xls)
Population_pyramids_Canada_1871_1891.xls |