|
|
||||||
Area units: Data units: |
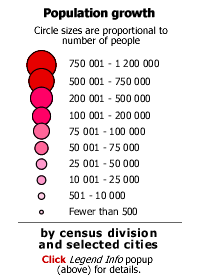 |
Population growth |
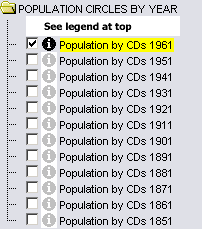 |
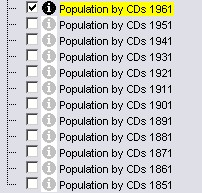
This folder contains layers showing census divisions, and population circles for the given year. Turning on one of these layers makes it the active layer, see Active Tools below for explanation. |
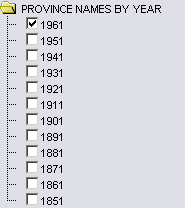 |
This folder contains layers showing the province/territory/colony names for the corresponding Population by CDs layer above. Check which Population by CDs layer you have on, and click on the corresponding year in this folder to view the appropriate labels. |
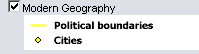 |
This layer shows Modern Geography (current provincial and territorial boundaries, as well as selected cities), and is available for reference. |
 |
Zoom In: Zoom in to see labels for census divisions and selected cities. |
 |
The active layers in this map are in the POPULATION CIRCLES BY YEAR folder. Use the tools below to get data about the these layers. |
 |
Whichever layer within the POPULATION CIRCLES BY YEAR folder is checked is the active layer. Use the tools below to get data about the population circles for a given layer. |
Identify: Click on the Identify tool, then click on the map on one of the census divisions or selected cities, to pop up a box showing the name of the census division or city. |
|
Table: Click on the Table tool, then click or drag a rectangle on the map across one or more census divisions/cities, to select them and pop up a table showing information about the selected census division/city. See Table Fields below. |
|
| Query: Click on the Query tool, to pop up a Query box. Use the input boxes to specify selection criteria and click "Submit query" to pop up a table showing information about the census divisions which fit the criteria. See Table Fields below. |
| CD Name | Census Division name (termed "Census District" before 1921), or number if unnamed |
| Province Code | Province code: See code table below |
| Province | Name of Province, Territory, or Colony |
| CD Population | Population of Census Division |
| CD Area sq km | Area of Census Division in square kilometres |
| CD Pop Density | Population Density of Census Division in persons per sq. km. |
| PROVINCE CODE | NAME | NOM |
| al | Alberta | Alberta |
| bc | British Columbia | Colombie-Britannique |
| pe | Prince Edward Island | Île-du-Prince-Édouard |
| mb | Manitoba | Manitoba |
| nb | New Brunswick | Nouveau-Brunswick |
| ns | Nova Scotia | Nouvelle-Écosse |
| nu | Nunavut | Nunavut |
| on | Ontario | Ontario |
| pq | Québec | Québec |
| sa | Saskatchewan | Saskatchewan |
| nf | Newfoundland | Terre-Neuve |
| yu | Yukon Territory | Territoire du Yukon |
| nwt | Northwest Territories | Territoires du Nord-Ouest |
| tr | Territories | Territoires |
| ce | Canada East | Canada-Est |
| cw | Canada West | Canada-Ouest |
| lc | Lower Canada | Bas-Canada |
| uc | Upper Canada | Haut-Canada |