On the Browse topbar , click on "Population Composition 1891-1961"
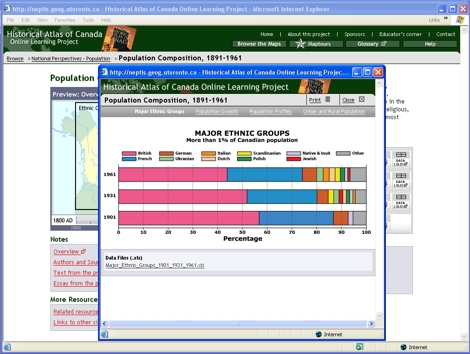
to return to the chapter page. Then open the graph "Major Ethnic Groups, 1901, 1931, 1961."
Notice ...
The proportion of non-French and non-British Canadians has grown
substantially between 1901 and 1961, entirely at the expense of the British component.
Consider!
This graph shows proportions, and absolute numbers may tell a different story.
(To find out, click on the data file under Data Files (.xls).)
All ethnic groups were probably growing between 1901 and 1961.