|
 |
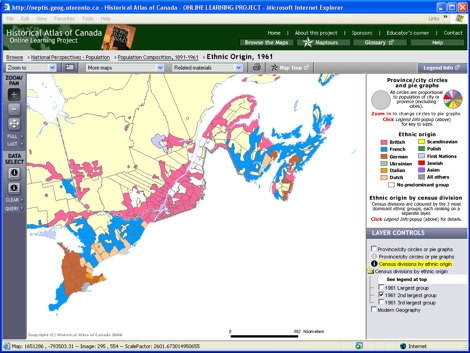
Try This:
- Turn on “1961 3rd largest group.”
- Cycle back and forth among all three options.
- On the DATA SELECT toolbar, click on the Table tool and then click on one of the Census divisions on the map, to open its pop-up data table .
|
|
 |
Notice ...
- The St. Lawrence valley was so homogeneous in 1961 that
it had no third ethnic group of significance (i.e. more than 1%); in a few cases
there was not even a second ethnic group of significance.
- First Nations citizens made only a tiny showing in second place,
but a far more substantial one in the third.
- British and French hardly ever are as low as third in the rankings in eastern Canada.
|
|
 |
Consider!
- New ethnic groups have been slow to establish themselves in eastern Canada.
- These maps give no hint about the proportions of each ethnic group in each
jurisdiction. The “largest” group could dominate, at close to 100%,
or merely be slightly bigger than others, even as low as 34%.
- In 1961 the census form called upon individuals to declare a single ethnicity,
even those Canadians of mixed heritage.
|