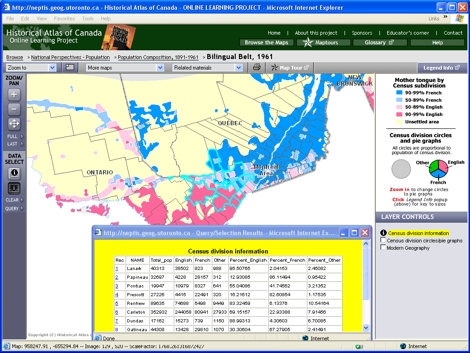
Maptour Page 8
Maptour: Population Composition, 1891-1961
A Little Data Management


Click to enlarge

Map: The Bilingual Belt, 1961

Try This:

  • Keep open the map "The Bilingual Belt, 1961."
  • Turn off the checkbox for "Modern Geography."
  • Use the Table tool to drag a rectangle that includes several Census Divisions, to select them.

Notice ...

  • A table box opens, giving details of French and English language use in each of the Census Divisions selected.
  • On the map, the borders of each of the Census Divisions selected have been highlighted. (You may have to drag the table aside to see the map.)

Try This:

  • On the DATA SELECT toolbar , click on “QUERY.”
  • In the Query box that opens, for “Percent French greater than or equal to” choose “90%.” For the other three statements, choose “Exclude from Query.” Then Submit Query .

Notice ...

  • A pop-up box with a table of 49 rows opens, responding to your query. (You may have to click on “More Records” to see all the entries. )

Consider!

  • You have here a demonstration of the concern about tiny percentages raised on page 5 of this Maptour.
  • Many opportunities exist for analysing language data.